Incidents & Alert Management
The Incidents & Alerts center (/sre/incidents and /sre/alert-rules) unifies automated alert detection, incident response, and multi-channel notification dispatching. SRE teams can track disruptions across services, assign incident ownership, and establish automated notification rules.
Active Incidents Dashboard
The incidents dashboard aggregates active disruptions, categorizing events by severity, duration, and impacted microservices.
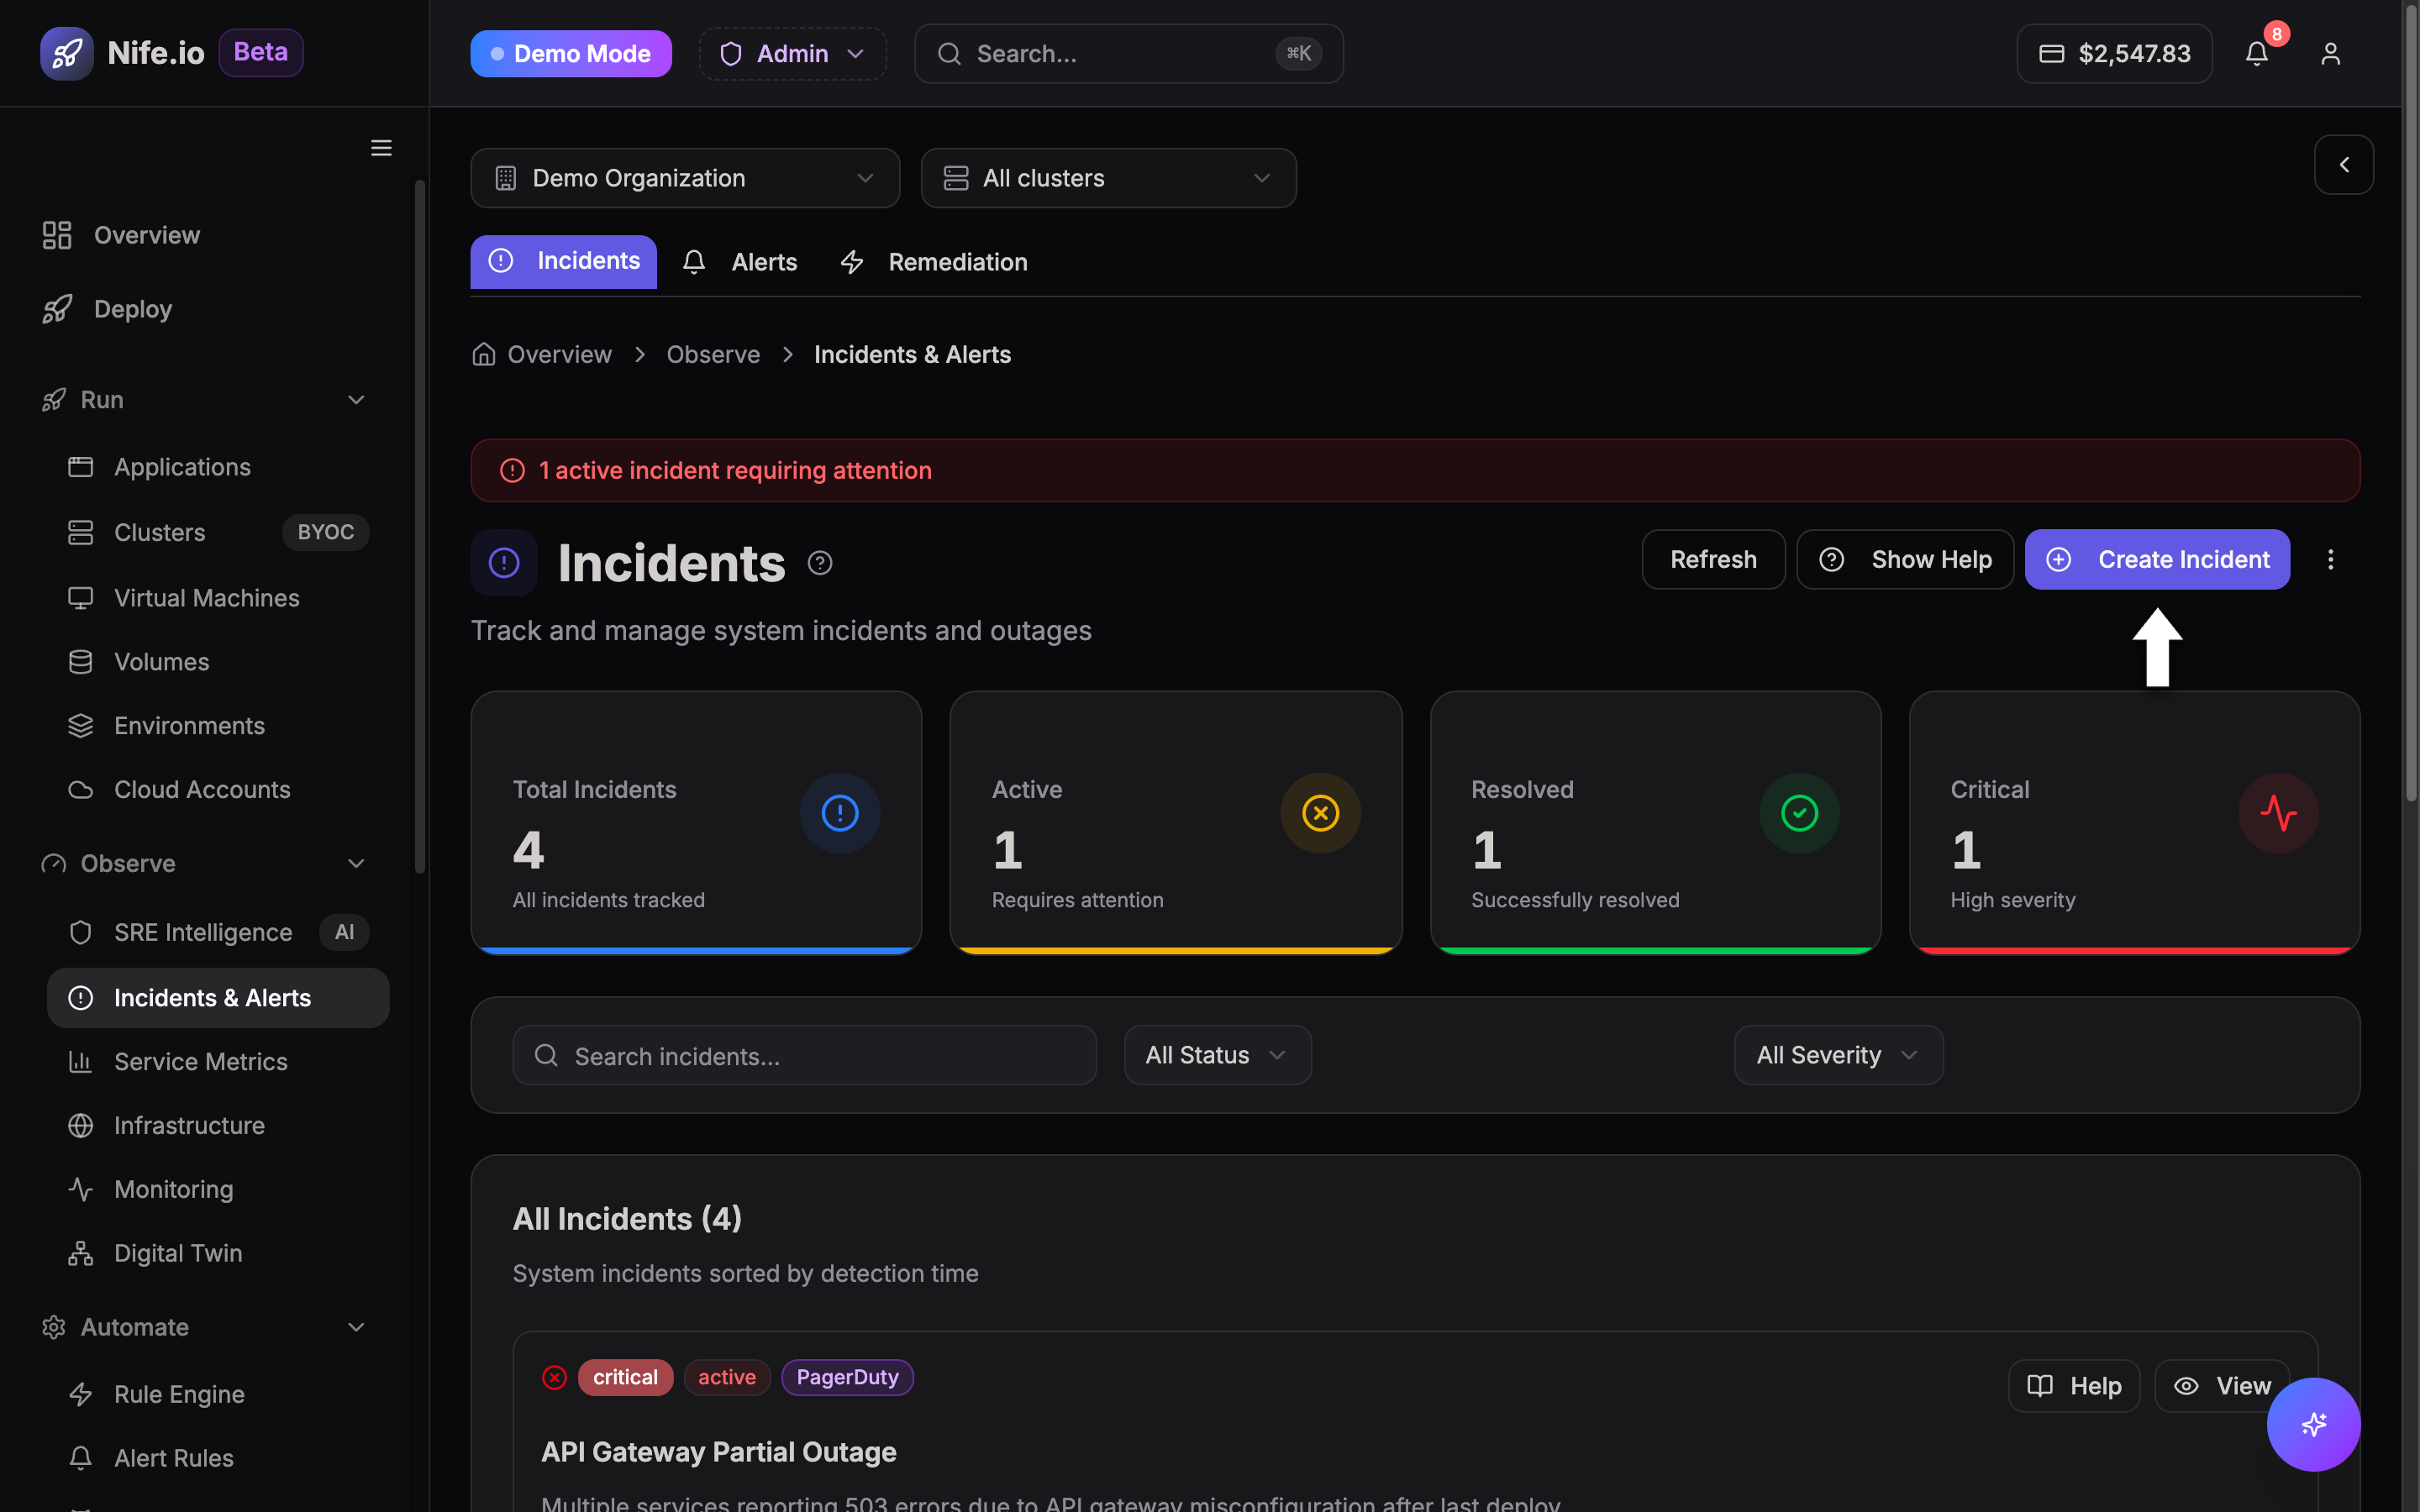
Incident Lifecycle States
Detected ──► Triggered ──► Acknowledged ──► Mitigated ──► Resolved
| State | Description | Typical Action |
|---|---|---|
| Triggered | Threshold breach or AI anomaly detected. | Automated alerts dispatched to Slack, PagerDuty, or Webhook. |
| Acknowledged | An engineer has claimed ownership of the incident. | Halts automated escalation timers. |
| Mitigated | Immediate fix applied (e.g., traffic rerouted or service rolled back). | Service restored; post-mortem analysis begins. |
| Resolved | Root cause verified and fixed. | Incident archived; audit log preserved. |
Configuring Alert Rules
Alert rules define conditions that automatically trigger incidents when latency, error rate, CPU, or container restarts exceed thresholds.
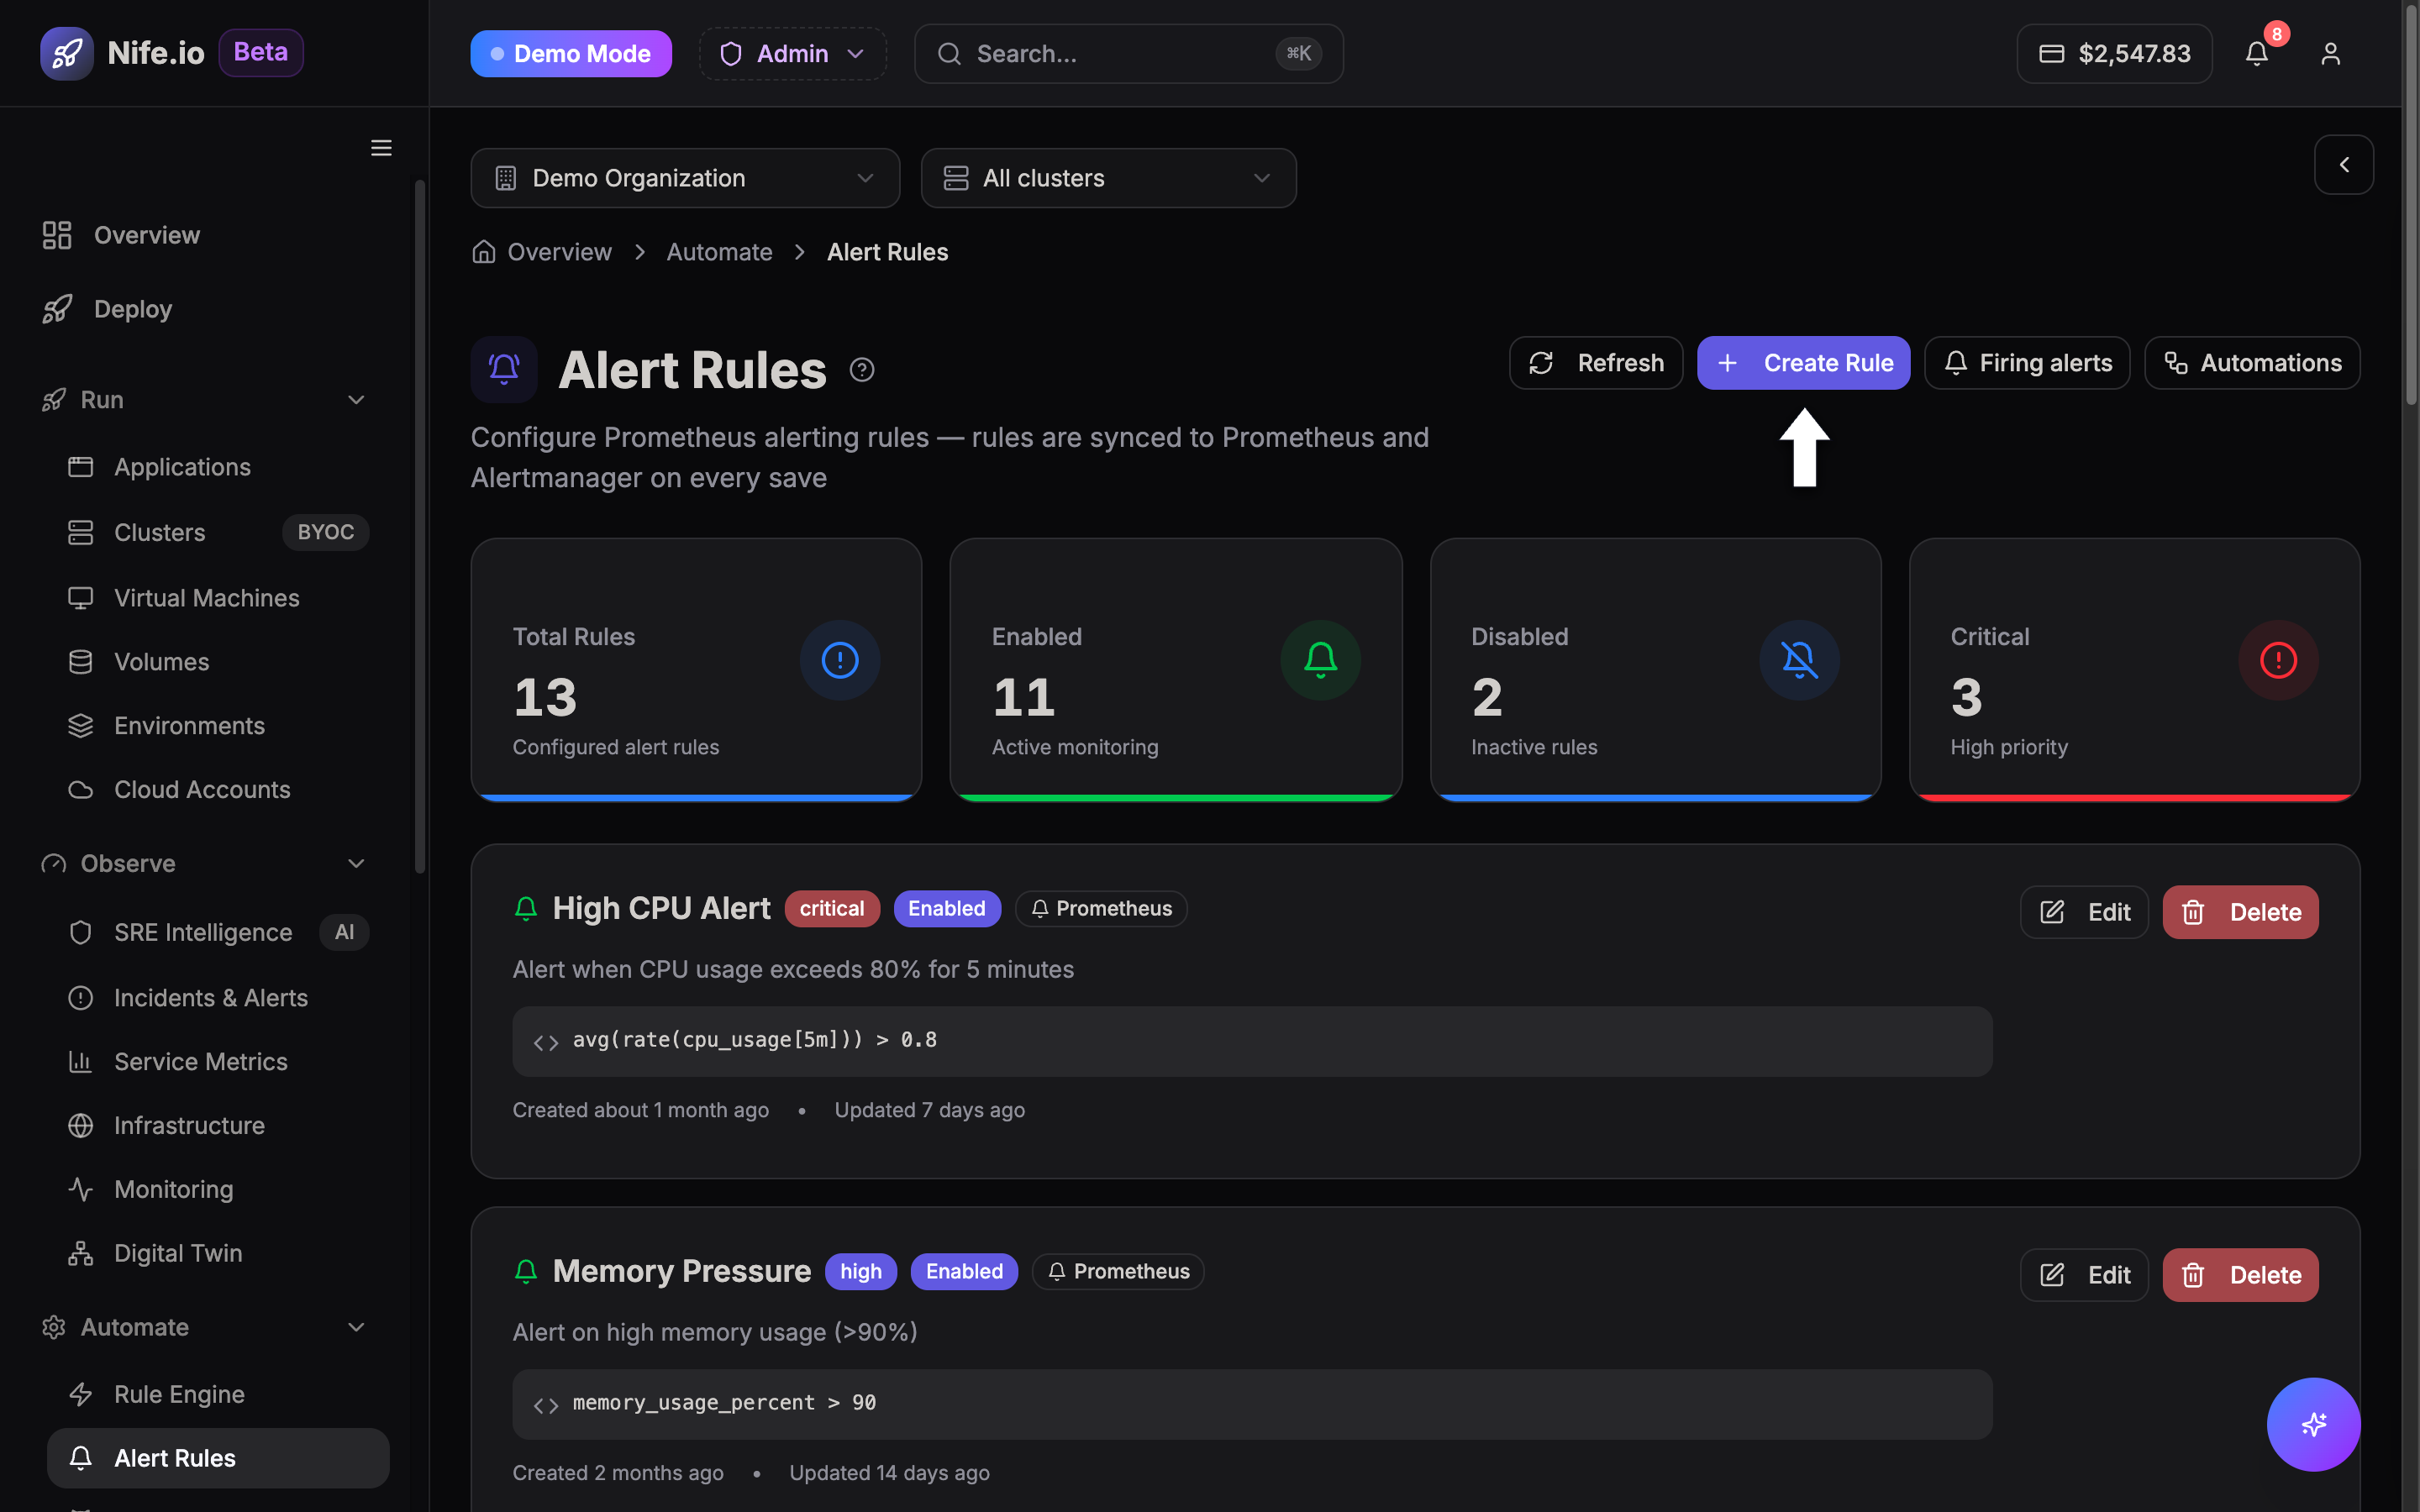
Creating an Alert Rule
Click Create Rule to configure custom evaluation thresholds, notification targets, and cooldown periods:
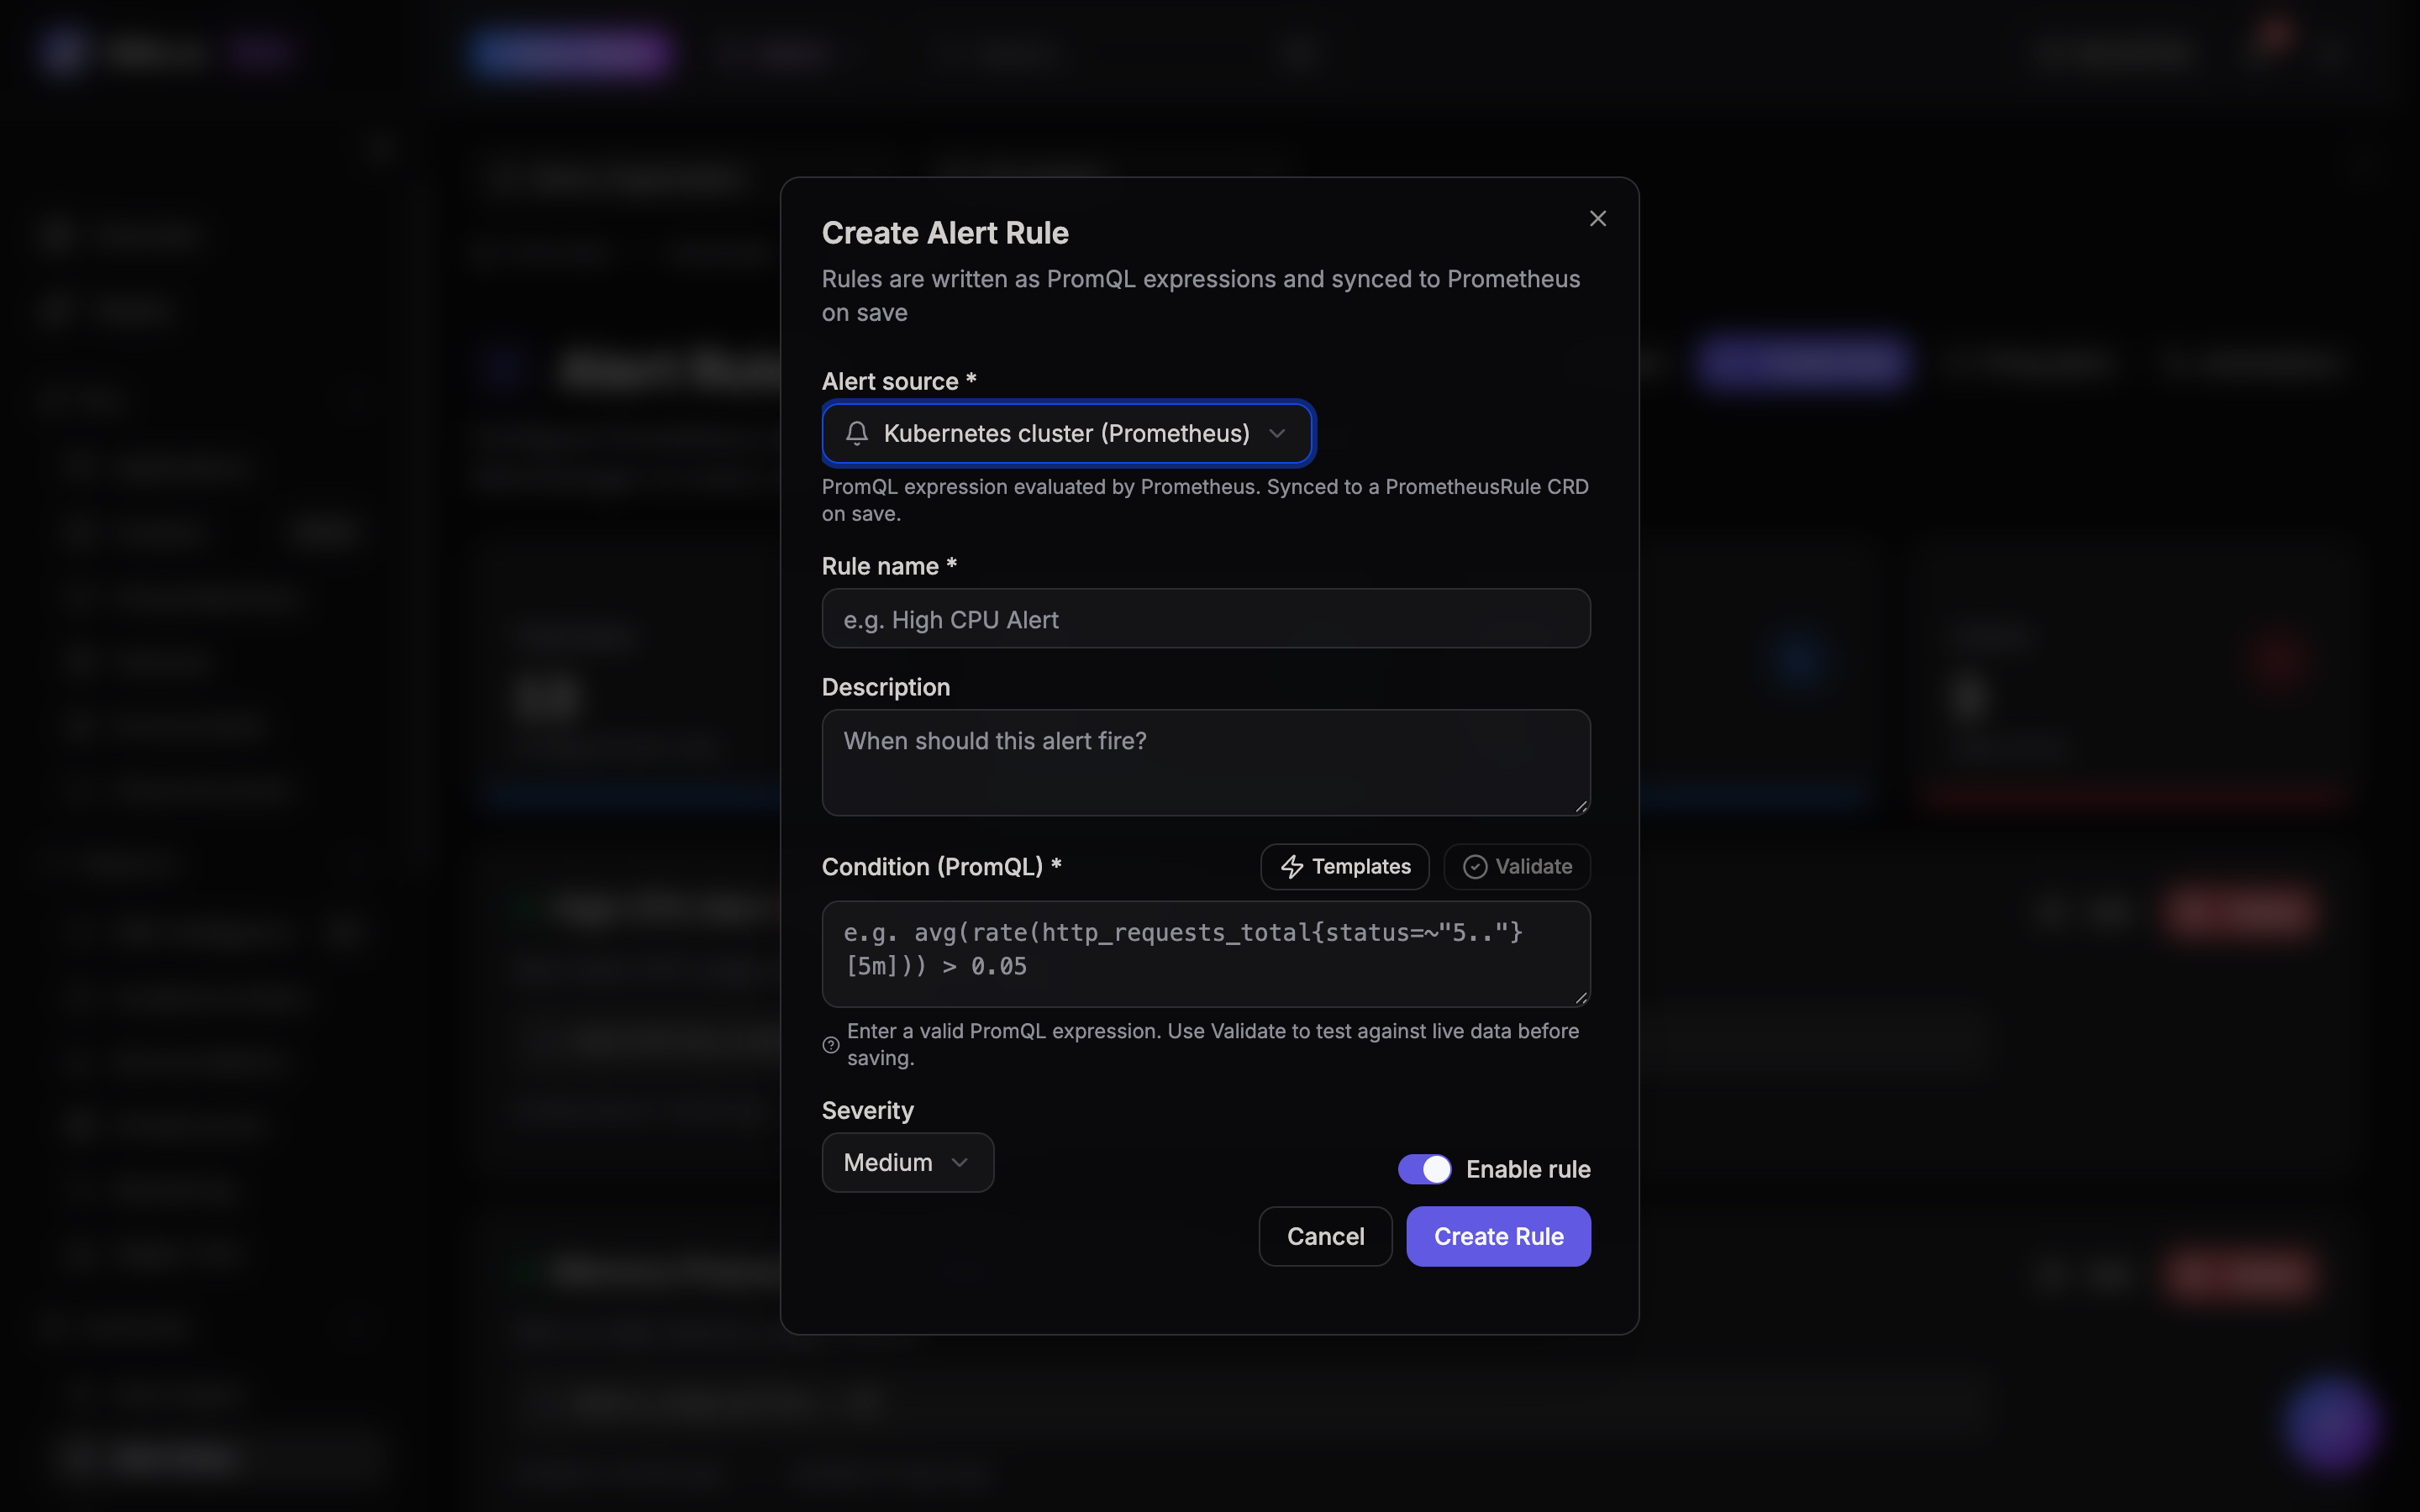
Supported Metrics & Conditions
- HTTP Response Error Rates: E.g.,
5xx status codes > 2%over a 5-minute rolling window. - Latency Percentiles: E.g.,
p95 latency > 800msfor 3 consecutive evaluation cycles. - Compute Saturation: E.g.,
Cluster Node Memory > 85%orPod CPU Throttling > 15%. - CrashLoopBackOff: Alerts immediately if any pod in production restarts more than 3 times in 10 minutes.
Notification Channels
Alerts can dispatch to:
- Slack & Microsoft Teams: Formatted webhook cards with quick acknowledgement links.
- PagerDuty & OpsGenie: Direct high-urgency on-call paging.
- Custom Webhooks: JSON payloads dispatched to your internal monitoring gateways (see Webhooks Guide).