Service Metrics
Monitor real-time performance metrics for your deployed services on Nife.
Service Metrics Dashboard
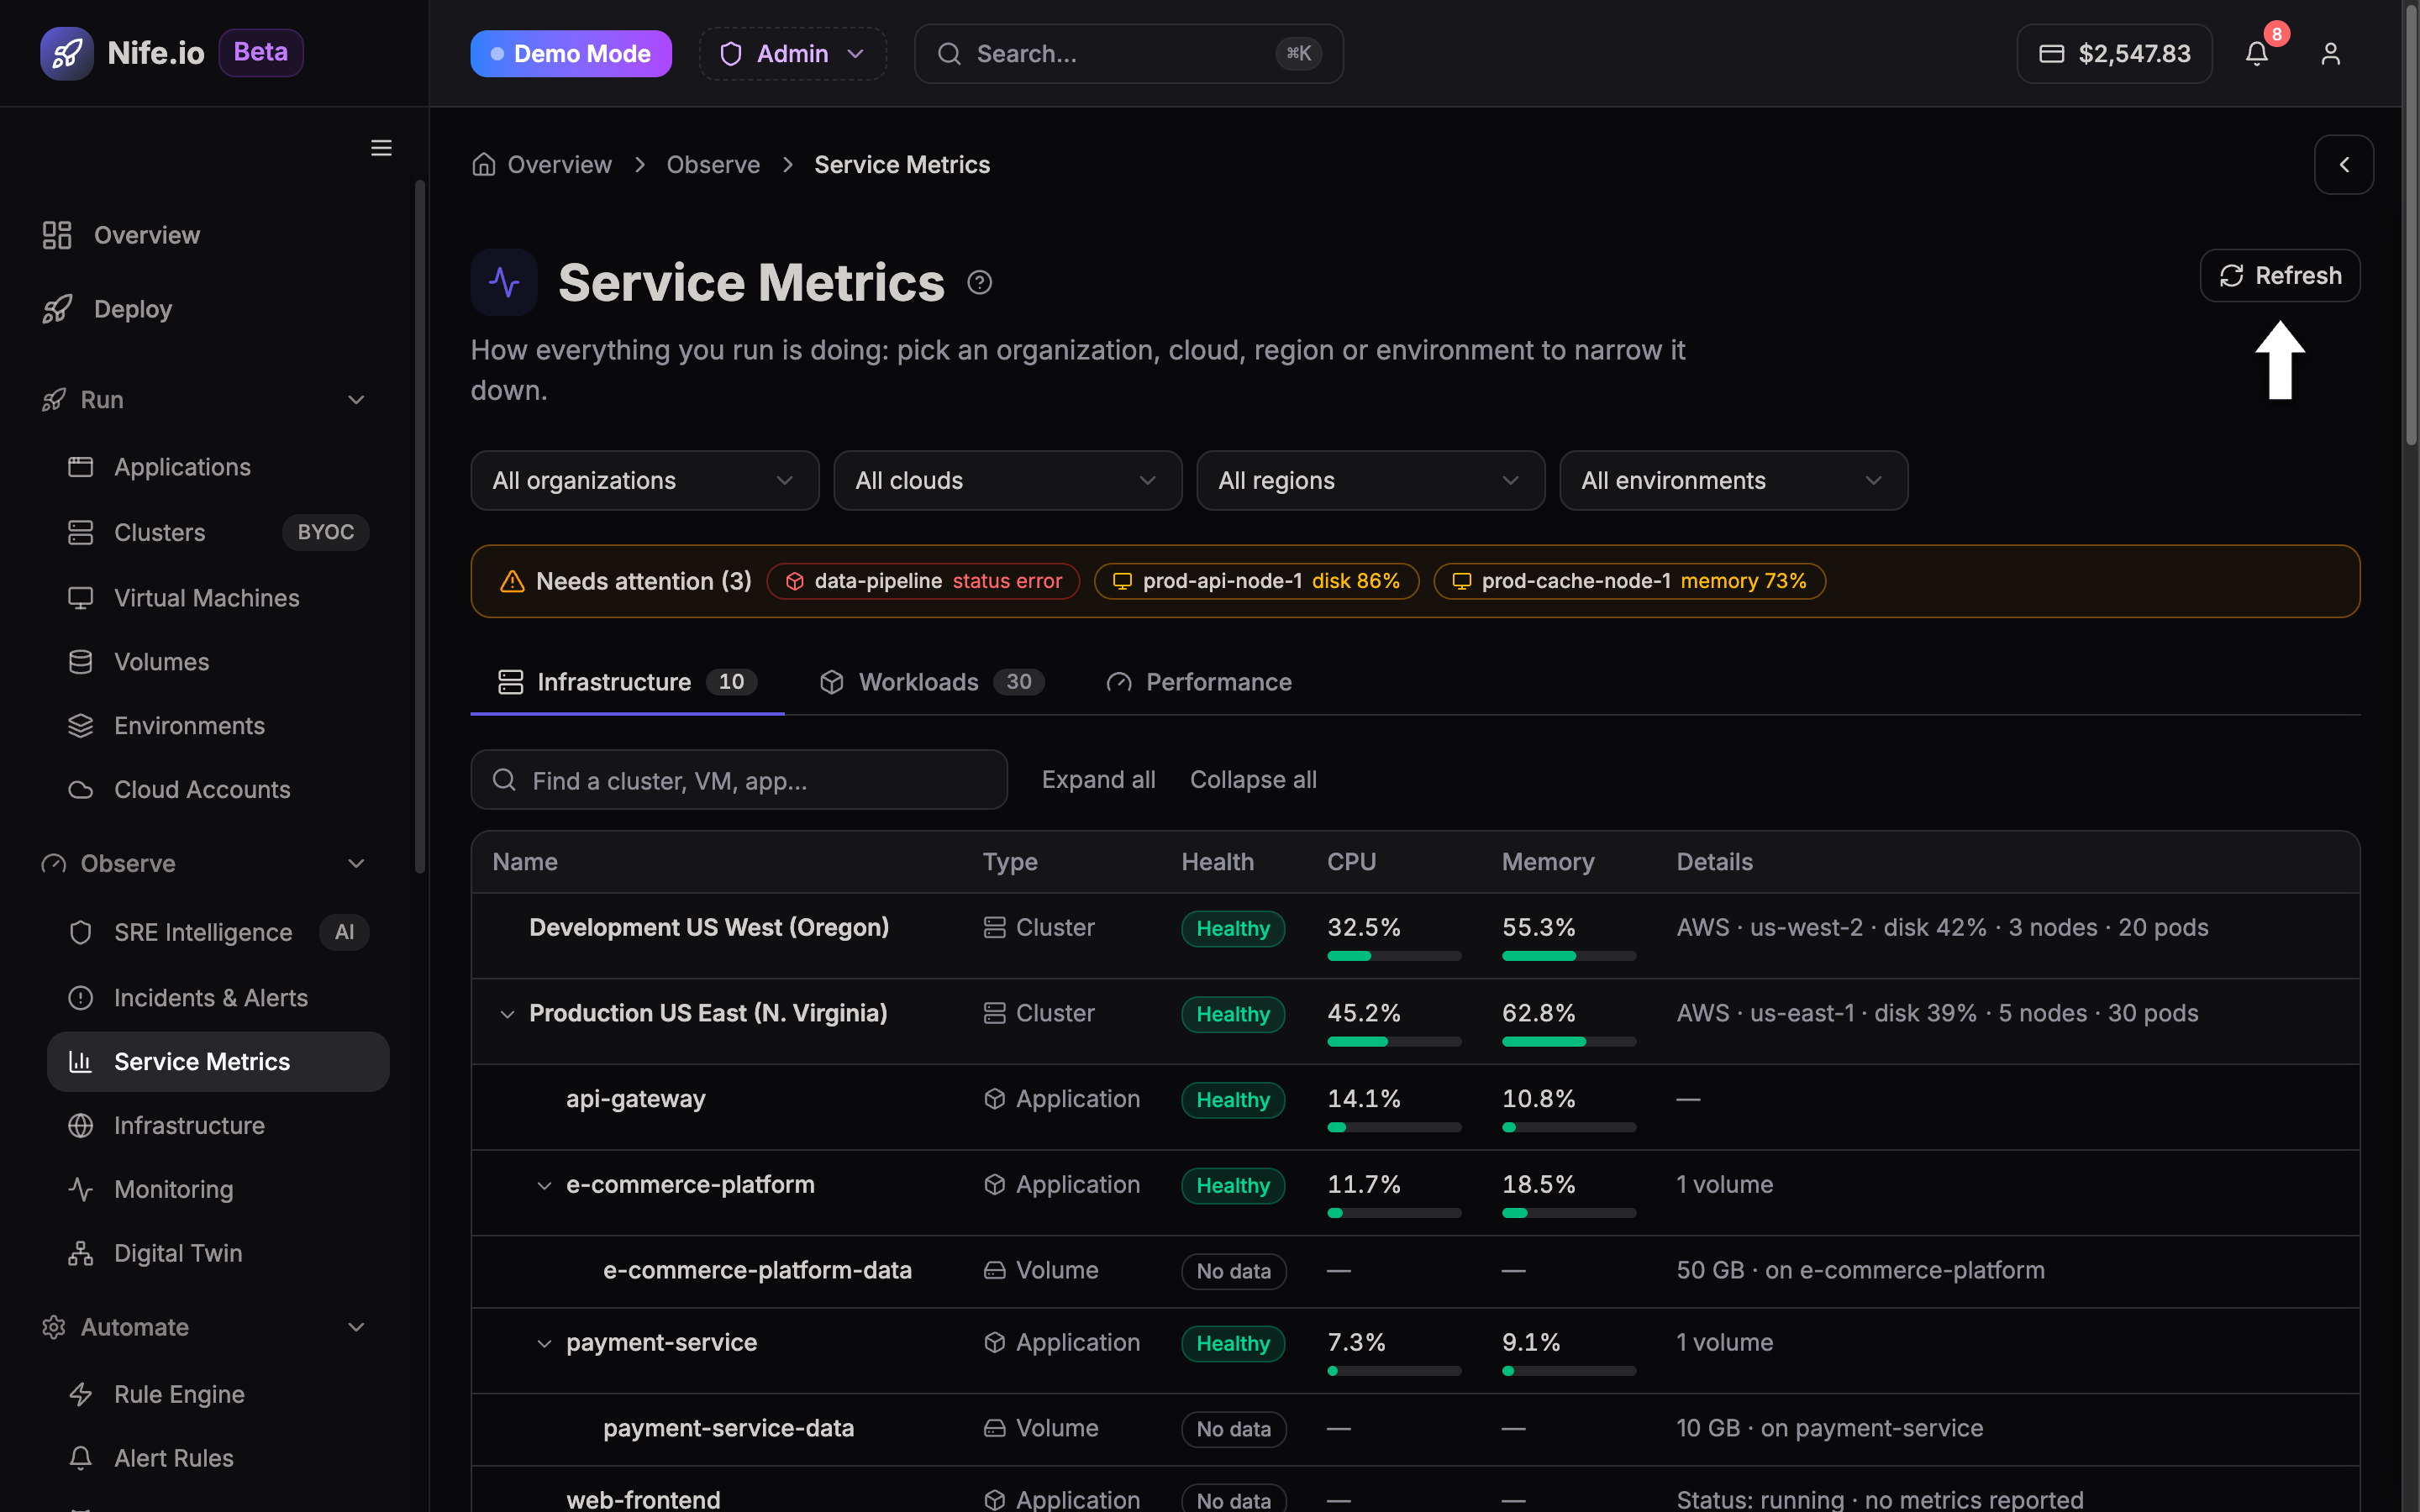
The Service Metrics dashboard (/service-metrics) provides high-resolution telemetry, resource heatmaps, and request performance metrics across running microservices and clusters.
Available Metrics
| Metric | Description |
|---|---|
| Request Rate | Number of incoming requests per second |
| Latency (P50/P95/P99) | Response time percentiles |
| Error Rate | Percentage of failed requests (4xx/5xx) |
| Throughput | Total data transferred per second |
| Availability | Uptime percentage over a time window |
Viewing Service Metrics
- Navigate to your application in the Nife dashboard
- Go to Insights → Service Metrics
- Select the time range (1h, 6h, 24h, 7d, 30d)
- Filter by environment, region, or cache node instance
- Click Refresh to stream the latest telemetry data
Setting Alerts on Metrics
You can trigger alerts when metrics cross thresholds. See Creating Alert Rules for setup.