DORA Metrics
The DORA Metrics provides a high-level overview of your organization's DevOps performance. By tracking four key metrics, it helps teams identify bottlenecks and improve software delivery speed and stability.
Metrics Overview
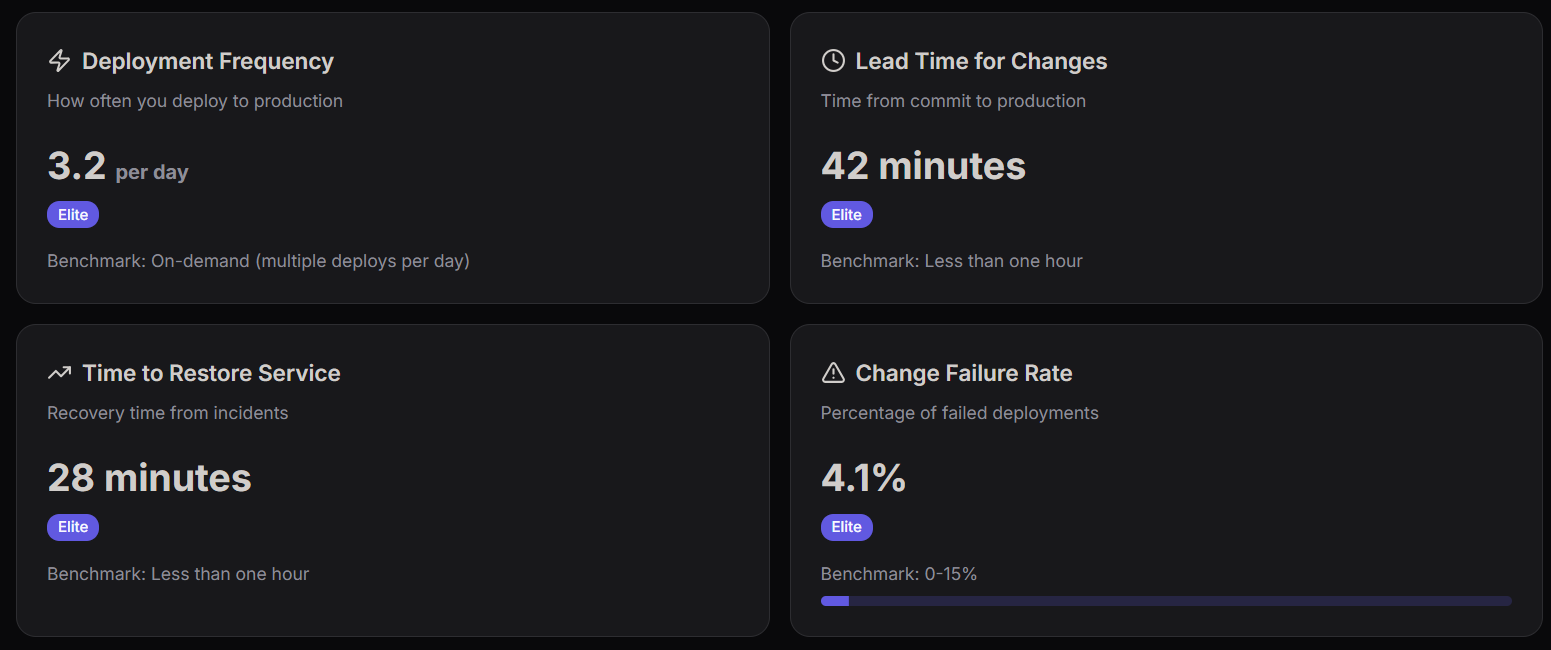
The dashboard categorizes performance into four standard DevOps Research and Assessment (DORA) metrics. Each metric includes a status benchmark comparison.
1. Deployment Frequency
- Definition: How often your organization successfully deploys to production.
- Your Metric: 3.2 per day.
- Benchmark: On-demand (multiple deploys per day).
2. Lead Time for Changes
- Definition: The amount of time it takes a commit to get into production.
- Your Metric: 42 minutes.
- Benchmark: Less than one hour.
3. Time to Restore Service
- Definition: The time it takes to recover from a failure in production.
- Your Metric: 28 minutes.
- Benchmark: Less than one hour.
4. Change Failure Rate
- Definition: The percentage of deployments that cause a failure in production.
- Your Metric: 4.1%.
- Benchmark: 0-15%.
Recommendations
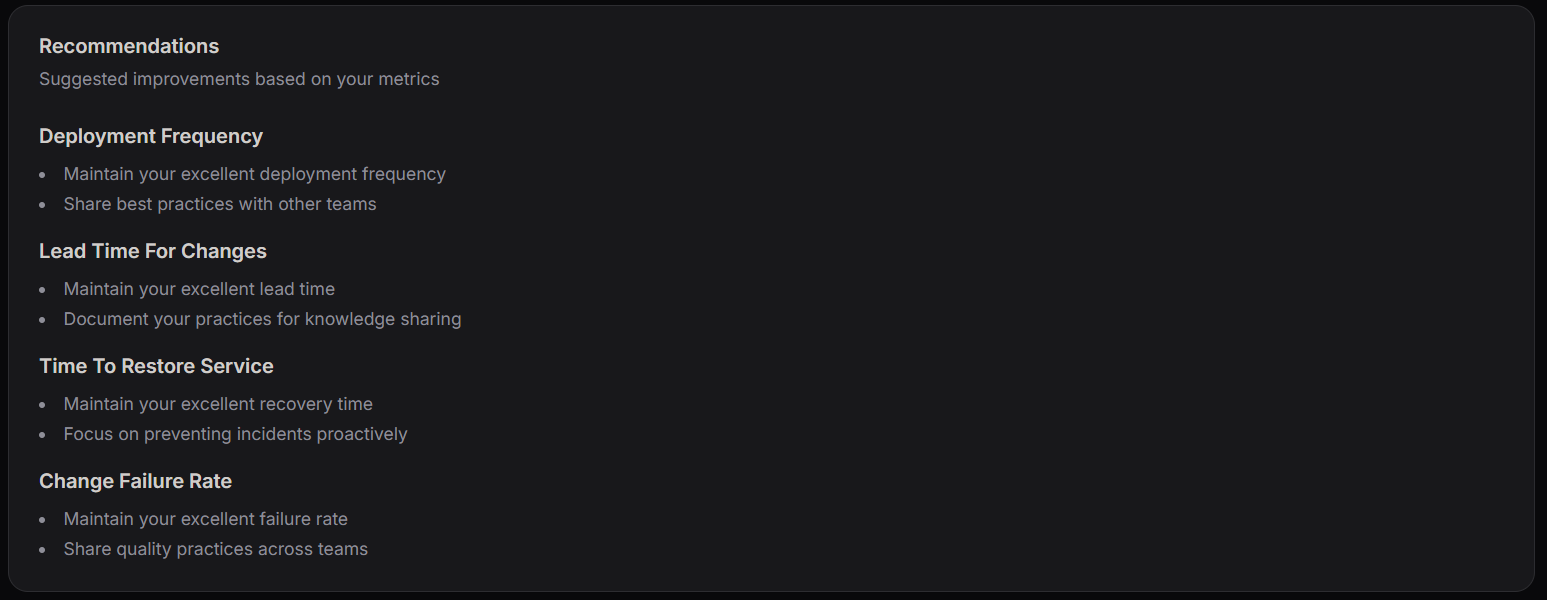
Based on your current performance data, the system provides actionable Recommendations to help maintain or improve your delivery standards.
| Metric | Suggested Improvement |
|---|---|
| Deployment Frequency | Maintain frequency and share best practices with other teams. |
| Lead Time for Changes | Document existing practices for organizational knowledge sharing. |
| Time to Restore Service | Focus on proactive incident prevention to maintain recovery times. |
| Change Failure Rate | Scale and share quality assurance practices across all teams. |
Performance Benchmarking
The dashboard uses the following performance tiers to categorize your team's DevOps maturity:
- Elite: Leading industry standards in both speed and stability.
- High: Strong performance with regular deployment cycles.
- Medium: Stable but with room for automation improvements.
- Low: Significant opportunities for process optimization.
Deployment Frequency Details
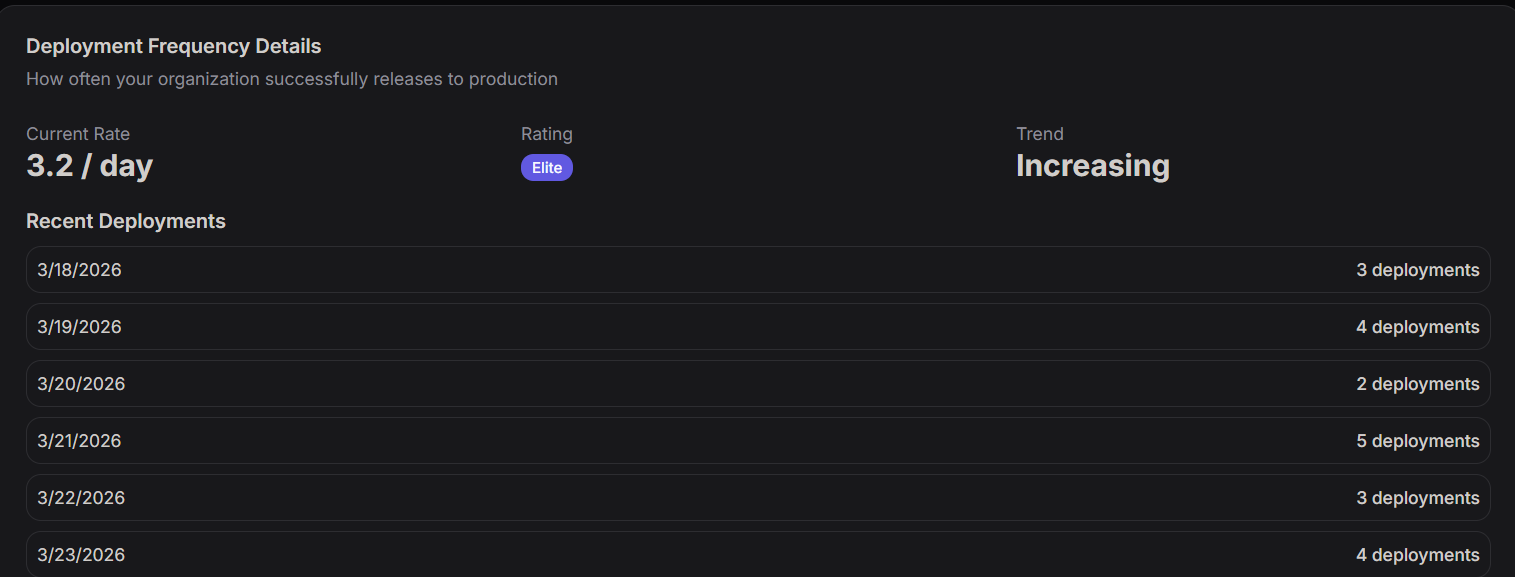
For a deeper analysis of shipping velocity, the Deployment Frequency Details view provides a breakdown of daily deployment volume and performance trends.
Performance Indicators
- Current Rate: Represents the average number of successful production releases per day (e.g., 3.2 / day).
- Rating: A maturity label based on industry benchmarks (e.g., Elite).
- Trend: Indicates whether deployment velocity is Increasing, Decreasing, or Stable compared to the previous period.
Recent Deployments (Daily Log)
This table tracks the exact number of deployments completed each day, allowing teams to spot patterns or lulls in activity.
| Date | Deployment Count |
|---|---|
| 3/18/2026 | 3 deployments |
| 3/19/2026 | 4 deployments |
| 3/20/2026 | 2 deployments |
| 3/21/2026 | 5 deployments |
| 3/22/2026 | 3 deployments |
| 3/23/2026 | 4 deployments |
Use Case
- Capacity Planning: Understand team throughput over a specific week.
- Trend Analysis: Correlate "Increasing" trends with new process implementations or tool adoptions.
- Verification: Ensure that automated deployments are triggering consistently as expected.
Lead Time for Changes Details
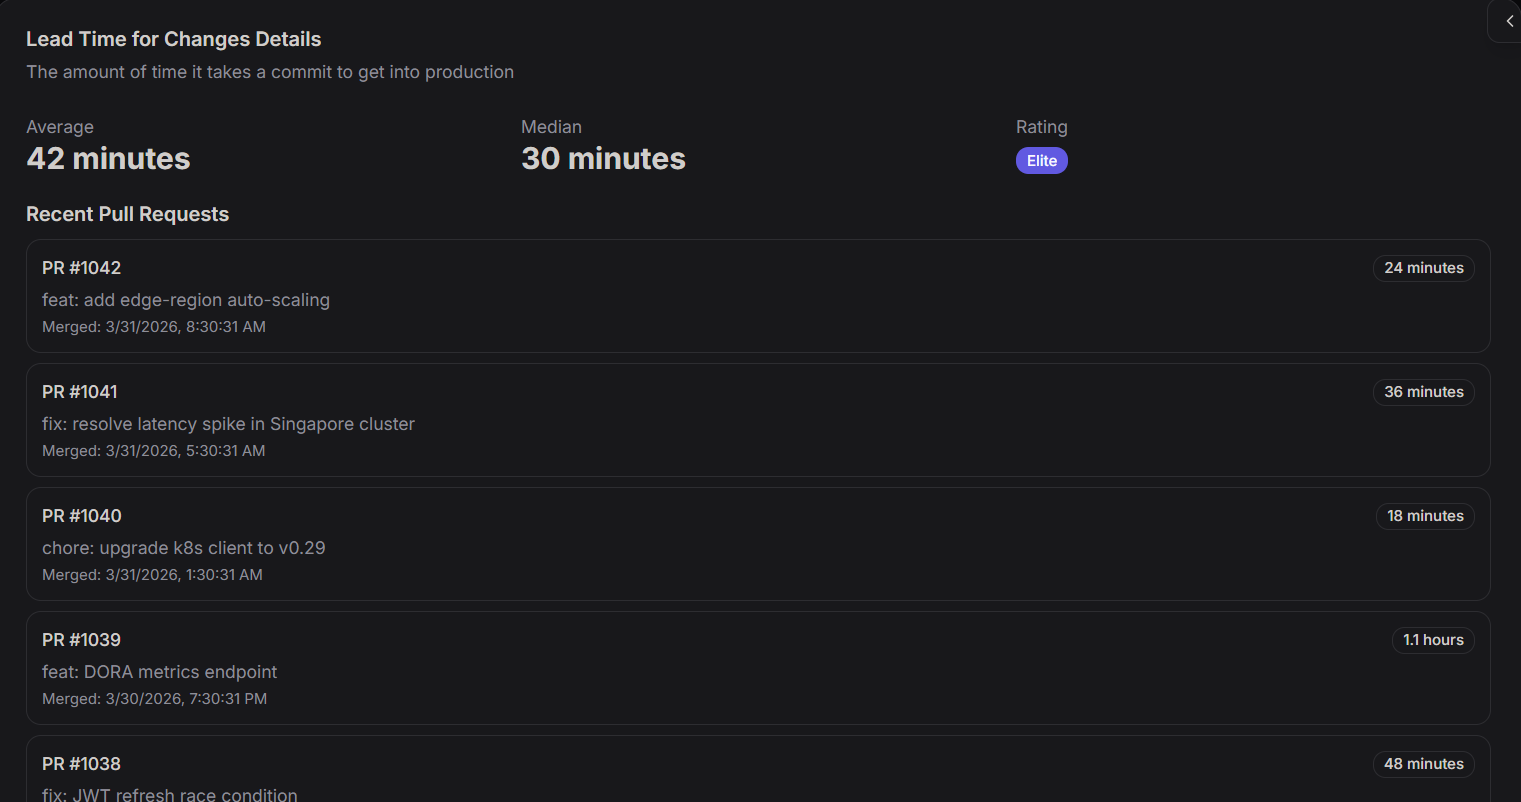
The Lead Time for Changes Details view provides a granular look at how quickly code moves from a commit/merge to a successful production deployment.
Aggregate Metrics
- Average: The mean time taken for changes to reach production (42 minutes).
- Median: The middle value of all lead times, offering a view of typical performance (30 minutes).
- Rating: Your performance category based on DORA standards (e.g., Elite).
Recent Pull Requests
This section tracks individual contributions, showing the exact time each unit of work took to be delivered.
| PR ID | Description | Merge Timestamp | Lead Time |
|---|---|---|---|
| PR #1042 | feat: add edge-region auto-scaling | 3/31/2026, 8:30:31 AM | 24 minutes |
| PR #1041 | fix: resolve latency spike in Singapore cluster | 3/31/2026, 5:30:31 AM | 36 minutes |
| PR #1040 | chore: upgrade k8s client to v0.29 | 3/31/2026, 1:30:31 AM | 18 minutes |
| PR #1039 | feat: DORA metrics endpoint | 3/30/2026, 7:30:31 PM | 1.1 hours |
| PR #1038 | fix: JWT refresh race condition | 3/30/2026, 4:30:31 PM | 48 minutes |
Use Case
- Bottleneck Identification: Identifying specific PRs that exceed the average (like PR #1039) to investigate delays in CI/CD or code review.
- Process Optimization: Comparing the Median vs. Average to see if a few "outlier" PRs are skewing your team's performance data.
- Auditability: Linking every production change back to its original PR for full traceability.
Time to Restore Service Details
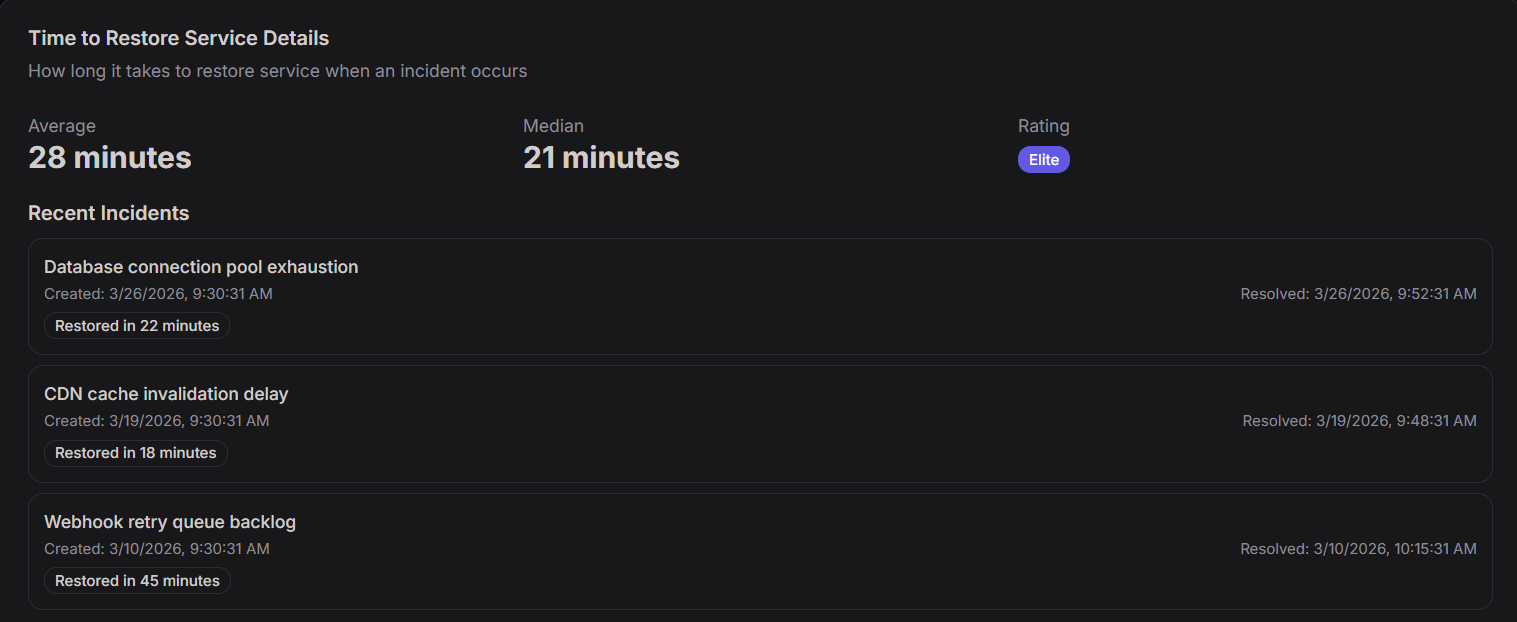
The Time to Restore Service Details view tracks how efficiently your organization recovers from service interruptions and production incidents.
Aggregate Metrics
- Average: The mean time required to resolve incidents and restore full service functionality (28 minutes).
- Median: The typical recovery time across all recorded incidents (21 minutes).
- Rating: The current performance tier based on restoration speed (e.g., Elite).
Recent Incidents
This section provides a logs of specific events that triggered a service restoration, including creation/resolution timestamps and the total time taken to recover.
| Incident | Created | Resolved | Restored In |
|---|---|---|---|
| Database connection pool exhaustion | 3/26/2026, 9:30:31 AM | 3/26/2026, 9:52:31 AM | 22 minutes |
| CDN cache invalidation delay | 3/19/2026, 9:30:31 AM | 3/19/2026, 9:48:31 AM | 18 minutes |
| Webhook retry queue backlog | 3/10/2026, 9:30:31 AM | 3/10/2026, 10:15:31 AM | 45 minutes |
Use Case
- Post-Mortem Analysis: Use specific incident data to perform Root Cause Analysis (RCA) and identify why certain issues (like queue backlogs) take longer to resolve than others.
- SLA Monitoring: Ensure that restoration times remain within agreed-upon Service Level Agreements (SLAs).
- Infrastructure Trends: Identify recurring incidents (e.g., database or CDN issues) that may require long-term architectural improvements rather than just quick fixes.
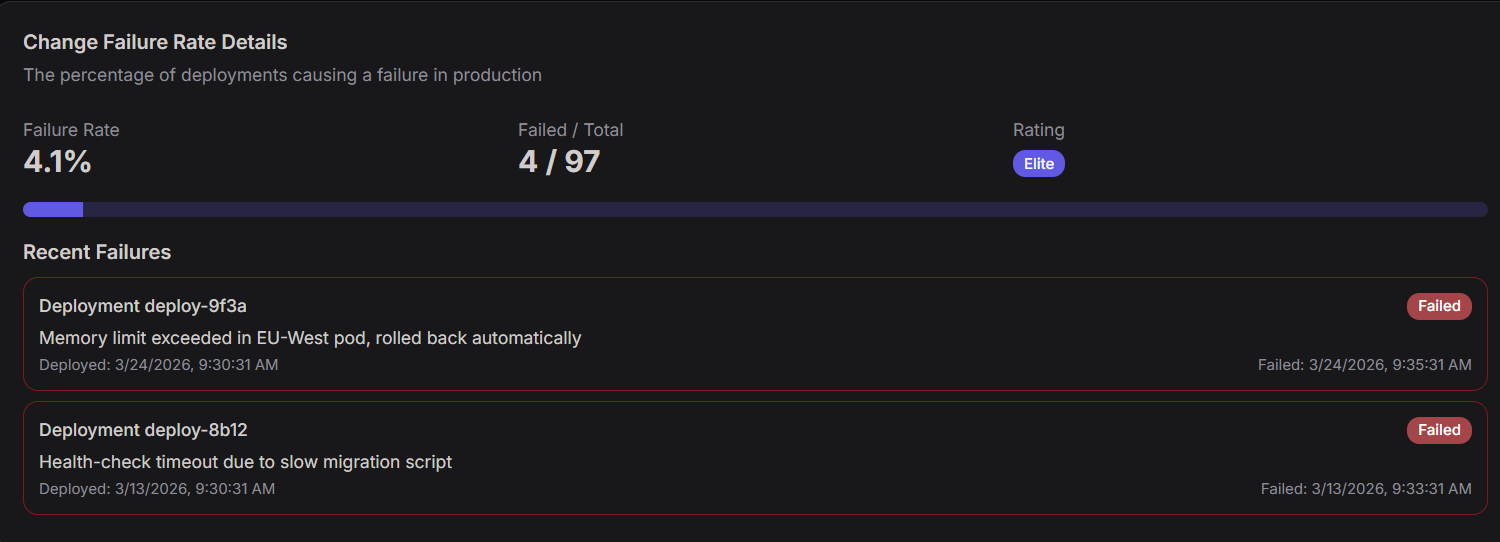
Change Failure Rate Details
The Change Failure Rate Details view provides a high-level and granular breakdown of deployment stability. It measures the percentage of releases that result in a failure in production, requiring a rollback or emergency fix.
Performance Overview
This section summarizes your stability health based on recent deployment history.
| Metric | Value | Description |
|---|---|---|
| Failure Rate | 4.1% | The percentage of total deployments that resulted in a failure. |
| Failed / Total | 4 / 97 | The raw ratio of failed deployments against total production releases. |
| Rating | Elite | Your performance tier based on industry DORA benchmarks. |
Recent Failures
The following log details specific deployments that triggered a failure state. This includes automated system responses and error descriptions.
Deployment: deploy-9f3a
- Status:
Failed - Error: Memory limit exceeded in EU-West pod, rolled back automatically.
- Deployed At: Mar 24, 2026, 9:30:31 AM
- Failed At: Mar 24, 2026, 9:35:31 AM
Deployment: deploy-8b12
- Status:
Failed - Error: Health-check timeout due to slow migration script.
- Deployed At: Mar 13, 2026, 9:30:31 AM
- Failed At: Mar 13, 2026, 9:33:31 AM
Analysis & Use Cases
Monitor the effectiveness of automated rollbacks and health checks. In the case of deploy-9f3a, the system successfully mitigated downtime by automatically reverting the change within 5 minutes.
Infrastructure Tuning
Identifying if specific regions or resource constraints (like the EU-West pod memory limits) are consistent sources of failure allows for proactive infrastructure scaling before the next deployment cycle.
Risk Assessment
Use the 4 / 97 ratio to determine if the team is maintaining a healthy balance between speed and quality. An "Elite" rating suggests that your CI/CD pipeline is robust enough to catch most issues before they impact the broader user base.