Deploy and Configure Cluster Agent
Connect and manage your Kubernetes clusters using Nife Cluster Agent. Deploy applications, monitor resources, perform security scans, health checks, and export metrics directly from your infrastructure using Bring Your Own Cloud (BYOC).
Overview
The Nife Cluster Agent enables you to:
- Deploy Applications - Deploy containerized applications directly to your clusters
- Monitor Resources - Track CPU, memory, disk, and active connections in real-time
- Health Checks - Monitor application and cluster health status
- Security Scanning - Identify vulnerabilities and security issues
- Metrics Export - Export performance metrics for analysis and alerting
- Configuration Management - Manage cluster configurations and settings
The Cluster Agent is lightweight and runs as a Kubernetes deployment, requiring minimal resources on your cluster.
Step 1: Access the Clusters Dashboard
- Log in to your Nife Dashboard.
- Navigate to Clusters from the left sidebar.
- You'll see an overview of all connected clusters and agents.
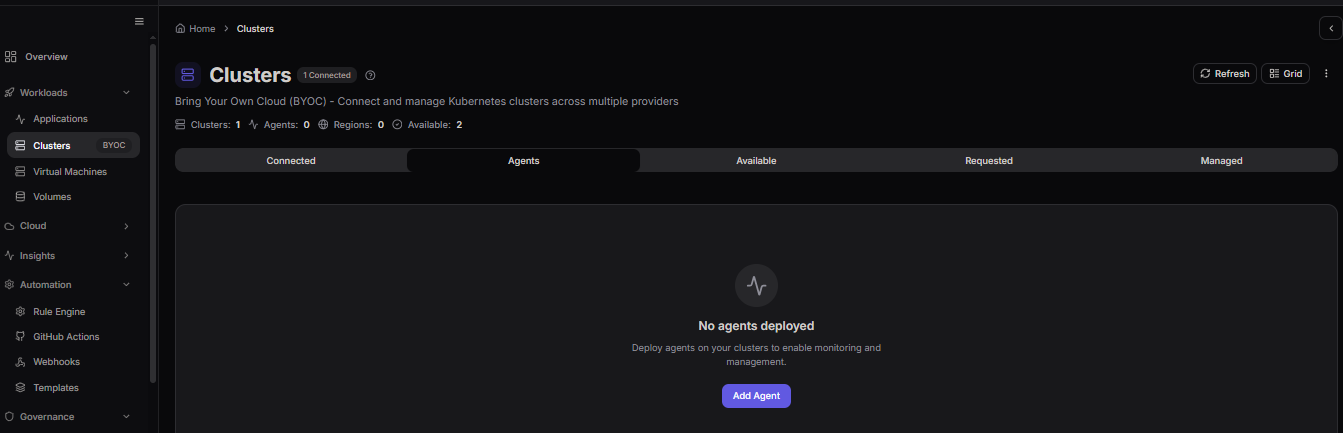
If you haven't added any agents yet, you'll see a "No agents deployed" message with a call-to-action to add your first agent.
Step 2: Add a New Agent
- Click the Add Agent button in the Clusters page.
- A modal dialog will appear with fields to configure your agent.
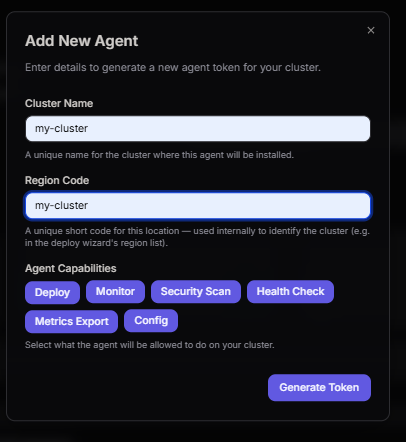
Configure Agent Details
Fill in the following information:
Cluster Name
- Enter a unique, descriptive name for your cluster (e.g.,
my-cluster,production-cluster) - This helps identify your cluster in the dashboard
Region Code
- Provide a region identifier or code for your cluster location
- Used internally to identify the cluster geographically (e.g.,
us-east-1,eu-west-1) - Useful for multi-cluster management across regions
Agent Capabilities
- Select which capabilities you want to enable for this agent:
- Deploy - Deploy applications to the cluster
- Monitor - Monitor cluster resources and metrics
- Health Check - Perform health checks on applications
- Security Scan - Run security vulnerability scans
- Metrics Export - Export metrics for external systems
- Config - Manage cluster configuration
Select all capabilities that match your requirements. You can modify these permissions later.
All capabilities are recommended for full cluster management functionality.
Step 3: Generate Agent Token
- After configuring the agent details, click the Generate Token button.
- Your agent token will be displayed with a security warning.
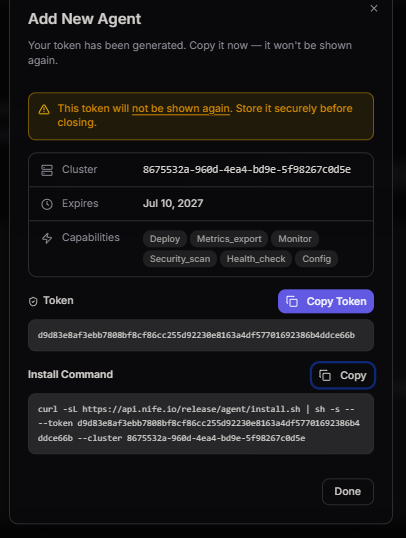
Important Security Information
Store your token securely - The token will only be displayed once. Copy it immediately to a secure location before closing this dialog. You cannot retrieve it later.
Token Details Displayed:
- Cluster ID - Unique identifier for your cluster (e.g.,
8675532a-96fd-4e4-bd9e-5f98267c0d5e) - Expiration Date - When the token will expire (e.g.,
Jul 10, 2027) - Capabilities - Summary of enabled agent capabilities
- Token Value - The secure token string used for cluster authentication
- Install Command - Pre-configured shell command to deploy the agent
Copy Token
Click the Copy Token button to copy the token to your clipboard. Store it securely in your password manager or secure vault.
Step 4: Copy and Execute Install Command
- Click the Copy button next to the Install Command.
- The complete installation command will be copied to your clipboard.
The install command looks like:
curl -sL https://api.nife.io/release/agent/install.sh | sh -s -- \
  --token d9d83e8af3ebb7808bf8cf86cc255d92230e8163a4df5770169238b64 \
  --cluster 8675532a-96fd-4e4-bd9e-5f98267c0d5e
This command automatically detects your system type and downloads the appropriate agent installer.
Step 5: Deploy Agent to Your Cluster
- Open a terminal with access to your Kubernetes cluster (via
kubectl). - Paste and execute the install command.
curl -sL https://api.nife.io/release/agent/install.sh | sh -s -- \
  --token <YOUR_TOKEN> \
  --cluster <YOUR_CLUSTER_ID>
Installation Process
The script will automatically:
- Create a
nife-systemnamespace for the agent - Deploy required Kubernetes RBAC (Role-Based Access Control) resources
- Configure service accounts and cluster roles
- Deploy the Nife Agent as a Kubernetes deployment
- Install Prometheus Operator for metrics collection
- Apply monitoring configurations
- Set up security scanning components
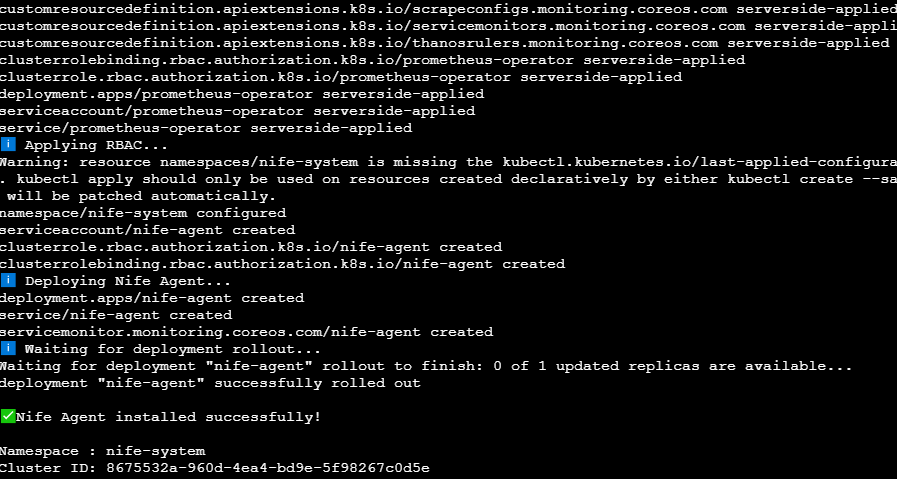
When the installation completes successfully, you'll see the message: "Nife Agent installed successfully!"
Step 6: Verify Agent Connection
After installation, return to the Nife Dashboard and refresh the Clusters page.
- Your cluster should now appear in the cluster list with a CONNECTED status.
- Click on your cluster to view detailed information.
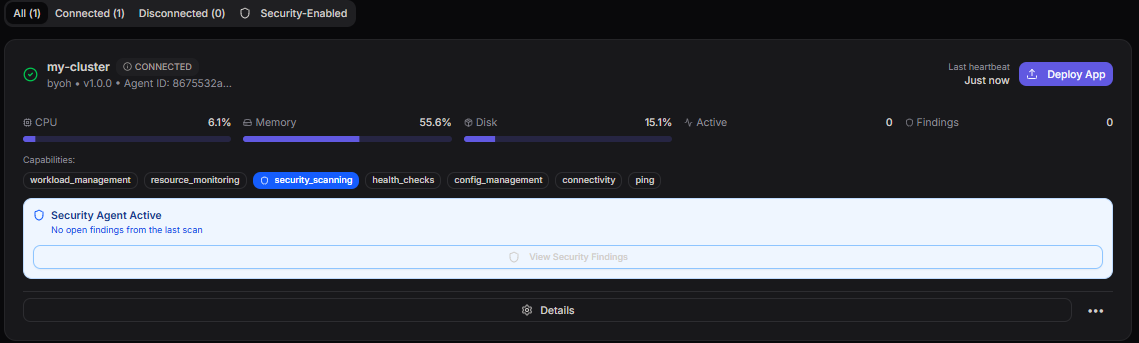
Monitor Agent Status
On the cluster details page, you can see:
Connection Status
- A green checkmark indicates the agent is actively connected
- Last heartbeat timestamp shows when the agent last communicated
- Cluster ID confirms the correct agent is running
Resource Metrics
- CPU - Current CPU usage percentage (e.g., 61.1%)
- Memory - Current memory usage percentage (e.g., 55.6%)
- Disk - Current disk usage percentage (e.g., 15.1%)
- Active Connections - Number of active connections to the cluster
Agent Capabilities
- View all enabled capabilities as status tags:
workload_management- Application deployment capabilityresource_monitoring- Resource monitoring enabledsecurity_scanning- Security scan capability activehealth_checks- Health check monitoring enabledconfig_management- Configuration management enabledconnectivity- Cluster connectivity verifiedping- Agent responsiveness confirmed
Security Status
- View the current security scan results
- Security Agent Active status
- Number of security findings from the last scan
The Deploy App button is now active, allowing you to deploy applications directly to your connected cluster.
Step 7: Deploy Applications to Your Cluster
With your agent successfully connected, you can now deploy applications.
- Click the Deploy App button on your cluster page.
- A deployment configuration modal will appear.
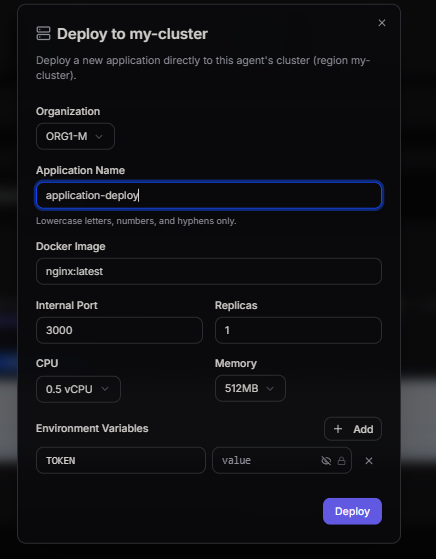
Configure Application Deployment
Fill in the application details:
Organization
- Select the organization owning this application
Application Name
- Enter a unique name for your application (e.g.,
application-deploy) - Use lowercase letters, numbers, and hyphens
Docker Image
- Specify the container image to deploy (e.g.,
nginx:latest,myapp:v1.0.0) - Must be accessible from your cluster
Internal Port
- Specify the port your application listens on (e.g.,
3000,8080) - This is the container's internal port, not the host port
Replicas
- Define the number of application instances to run (e.g.,
1,3) - Higher replicas provide better availability and load distribution
CPU Allocation
- Specify CPU resources (e.g.,
0.5 vCPU,1 vCPU) - Used for resource scheduling and limiting
Memory Allocation
- Specify memory resources (e.g.,
512MB,1024MB,2GB) - Used for memory scheduling and limiting
Environment Variables (Optional)
- Add key-value pairs for application configuration
- Example:
TOKEN=value,DEBUG=true - Click Add to include additional environment variables
Resource requests ensure the application has adequate CPU and memory. Limits prevent the application from consuming excessive resources.
Click Deploy to start the deployment process.
Next Steps
After your Cluster Agent is successfully deployed:
Monitor Cluster Health
- View real-time resource usage (CPU, memory, disk)
- Track active connections and agent health
- Monitor application status and performance
Configure Security Scanning
- Enable automated security vulnerability scanning
- Review security findings and compliance issues
- Set up security alerts and notifications
Setup Metrics Export
- Export metrics to external monitoring systems
- Integrate with Prometheus, Grafana, or other tools
- Create dashboards and alerts based on cluster metrics
Deploy Multiple Applications
- Deploy multiple containerized applications to your cluster
- Manage application configurations and environment variables
- Scale applications by adjusting replica counts
Manage Multi-Region Clusters
- Connect agents across multiple geographic regions
- Centrally manage cluster configurations
- Monitor health and performance across your infrastructure